Project1-Data visualisation
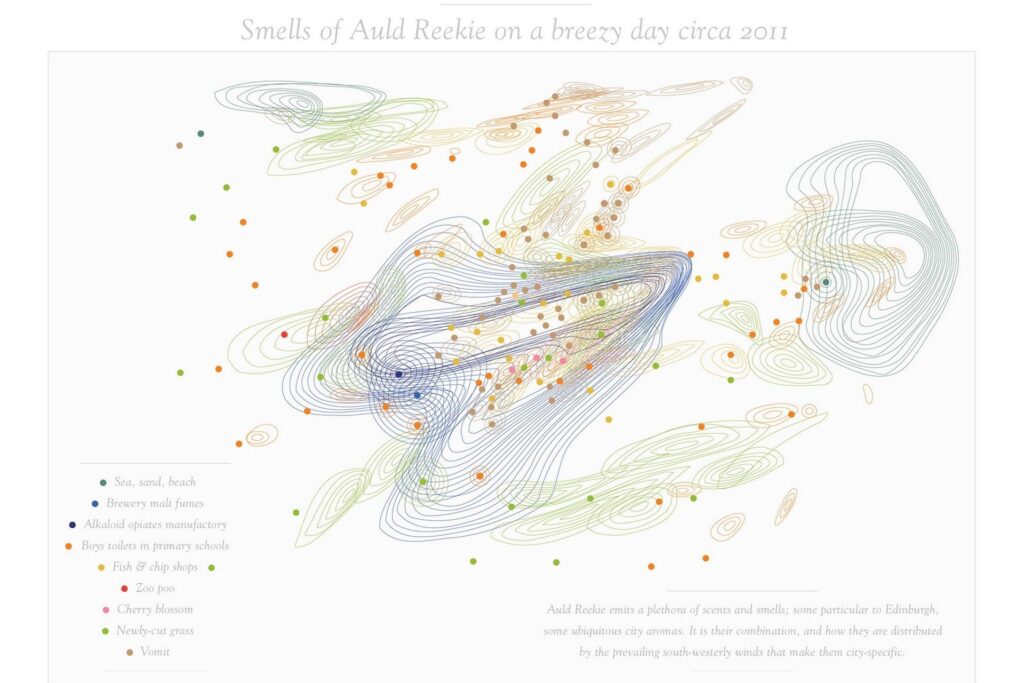
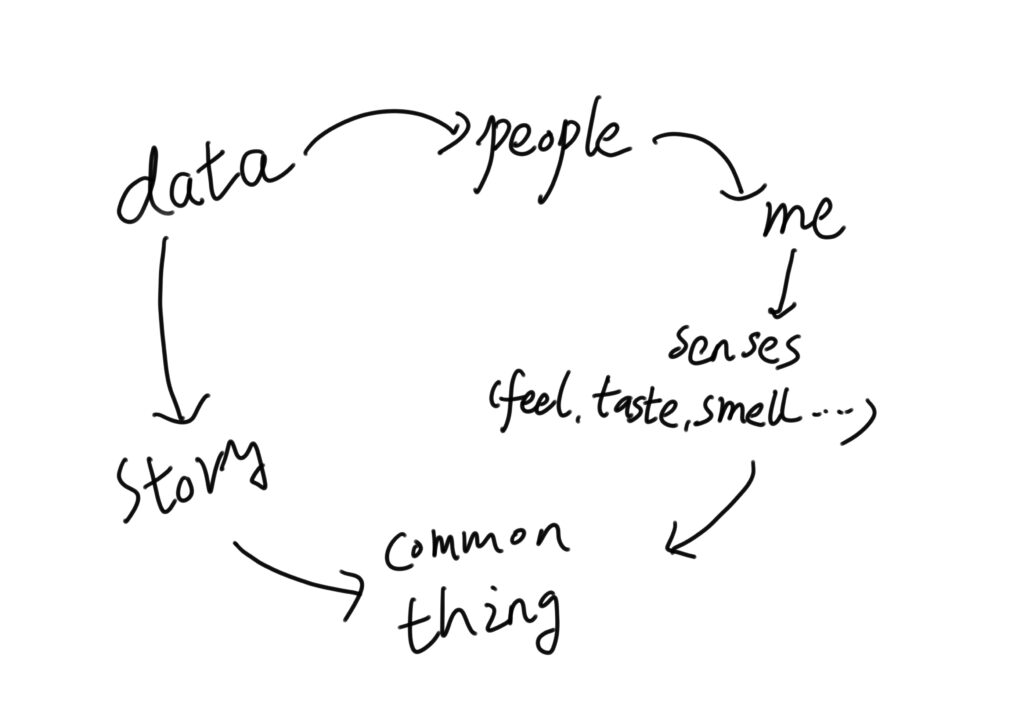
First of all the smell map inspired me to think that I could connect with people by recording some data related to the senses, so that the people looking at the data would have some empathy and they could understand what I was trying to tell by substituting my data.
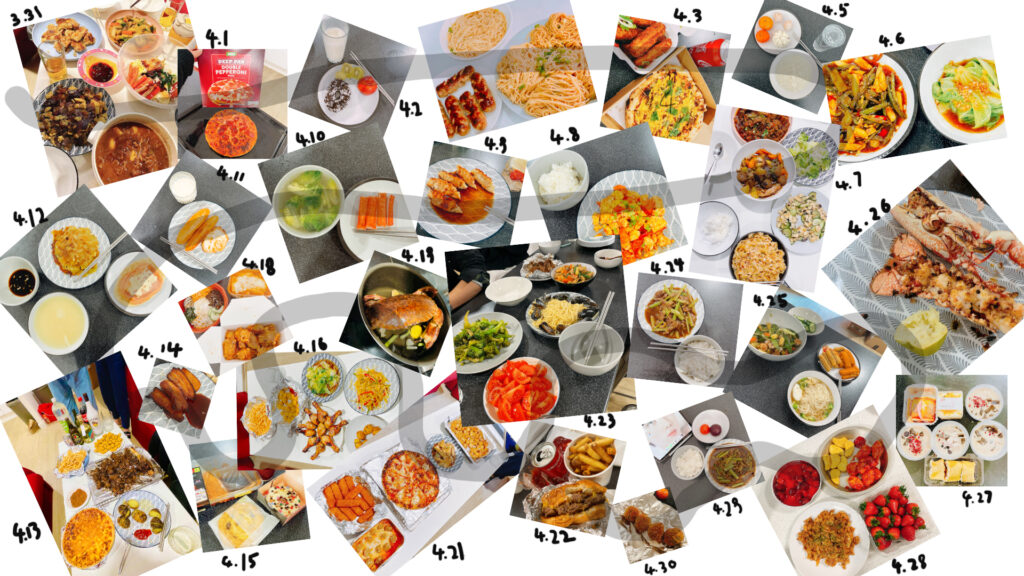
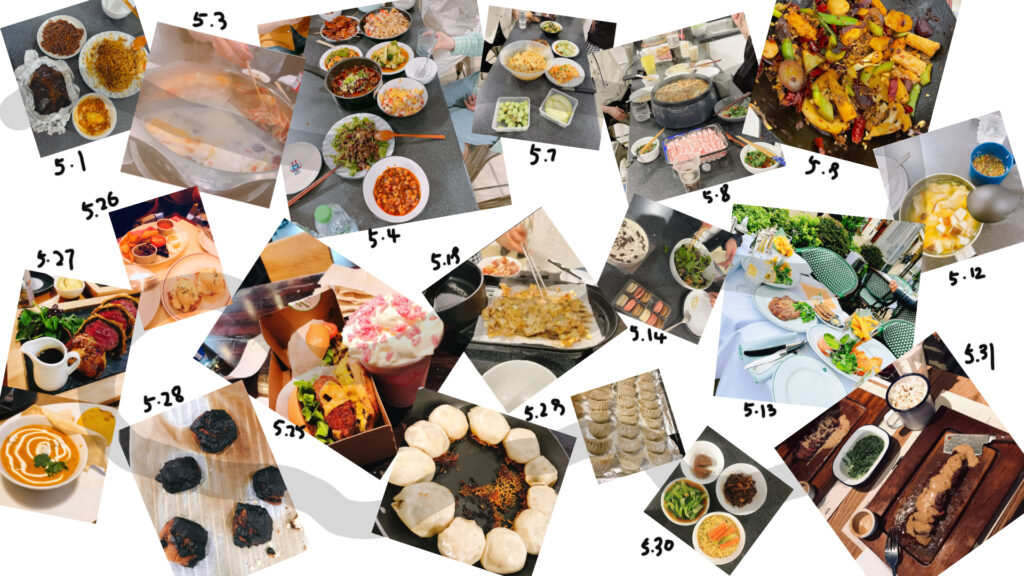
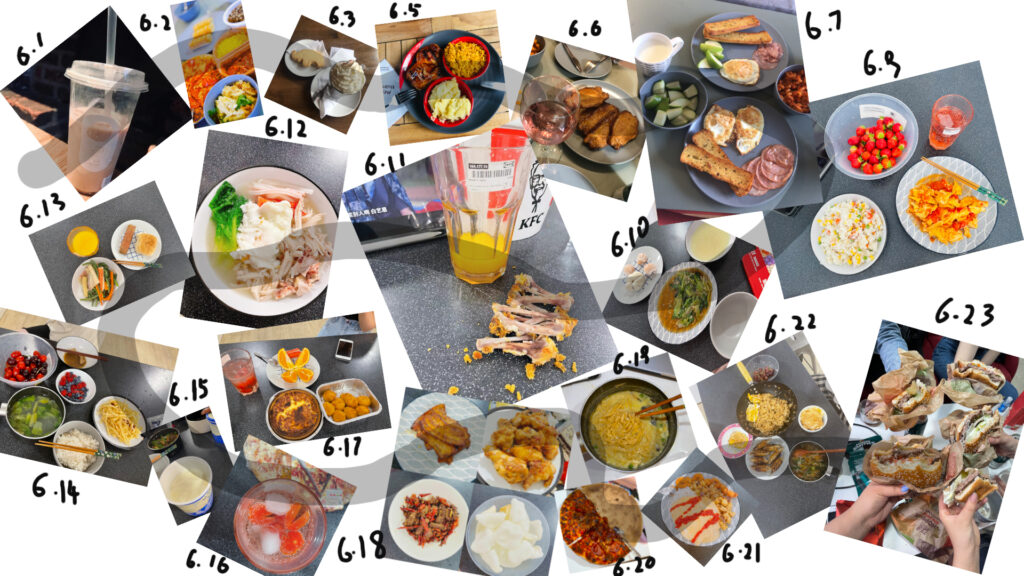
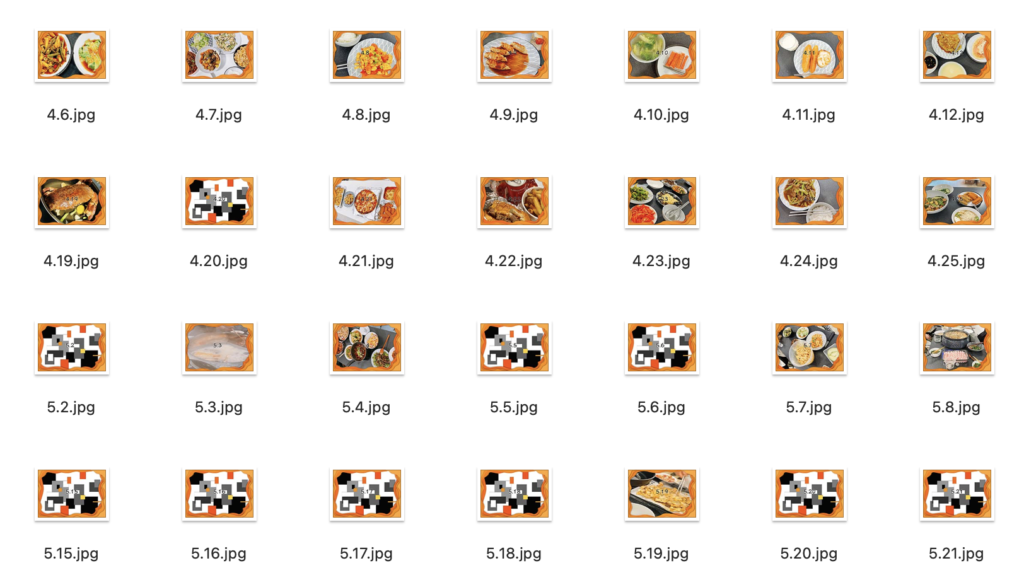
Then it occurred to me that I could record my daily meals as data through which I could tell a different story about my life every day. For example, meeting up with friends, going out for a play date or being on my own. All these things can be reflected in my meals.
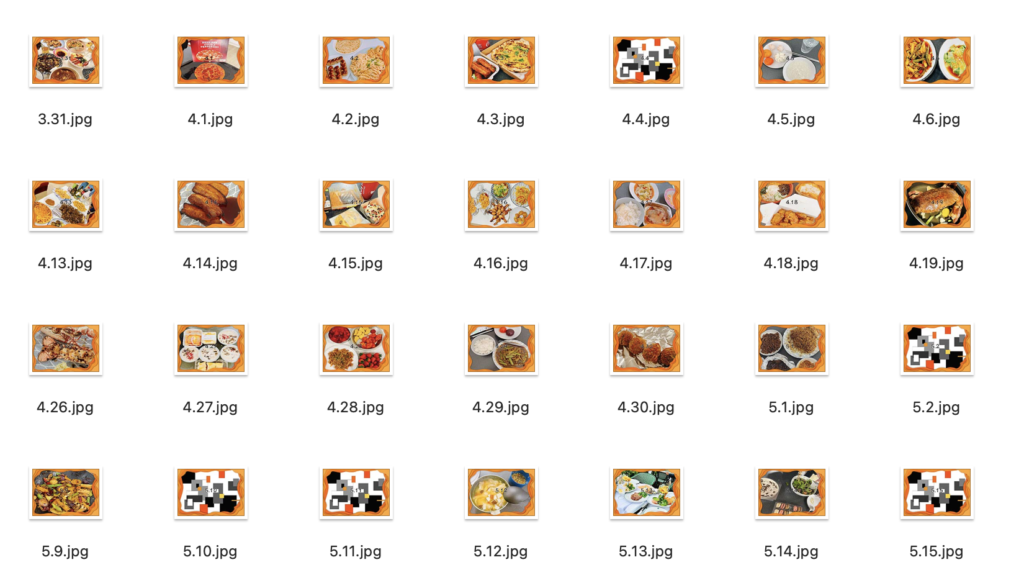
So I started collecting my data and here are some pictures of the data.
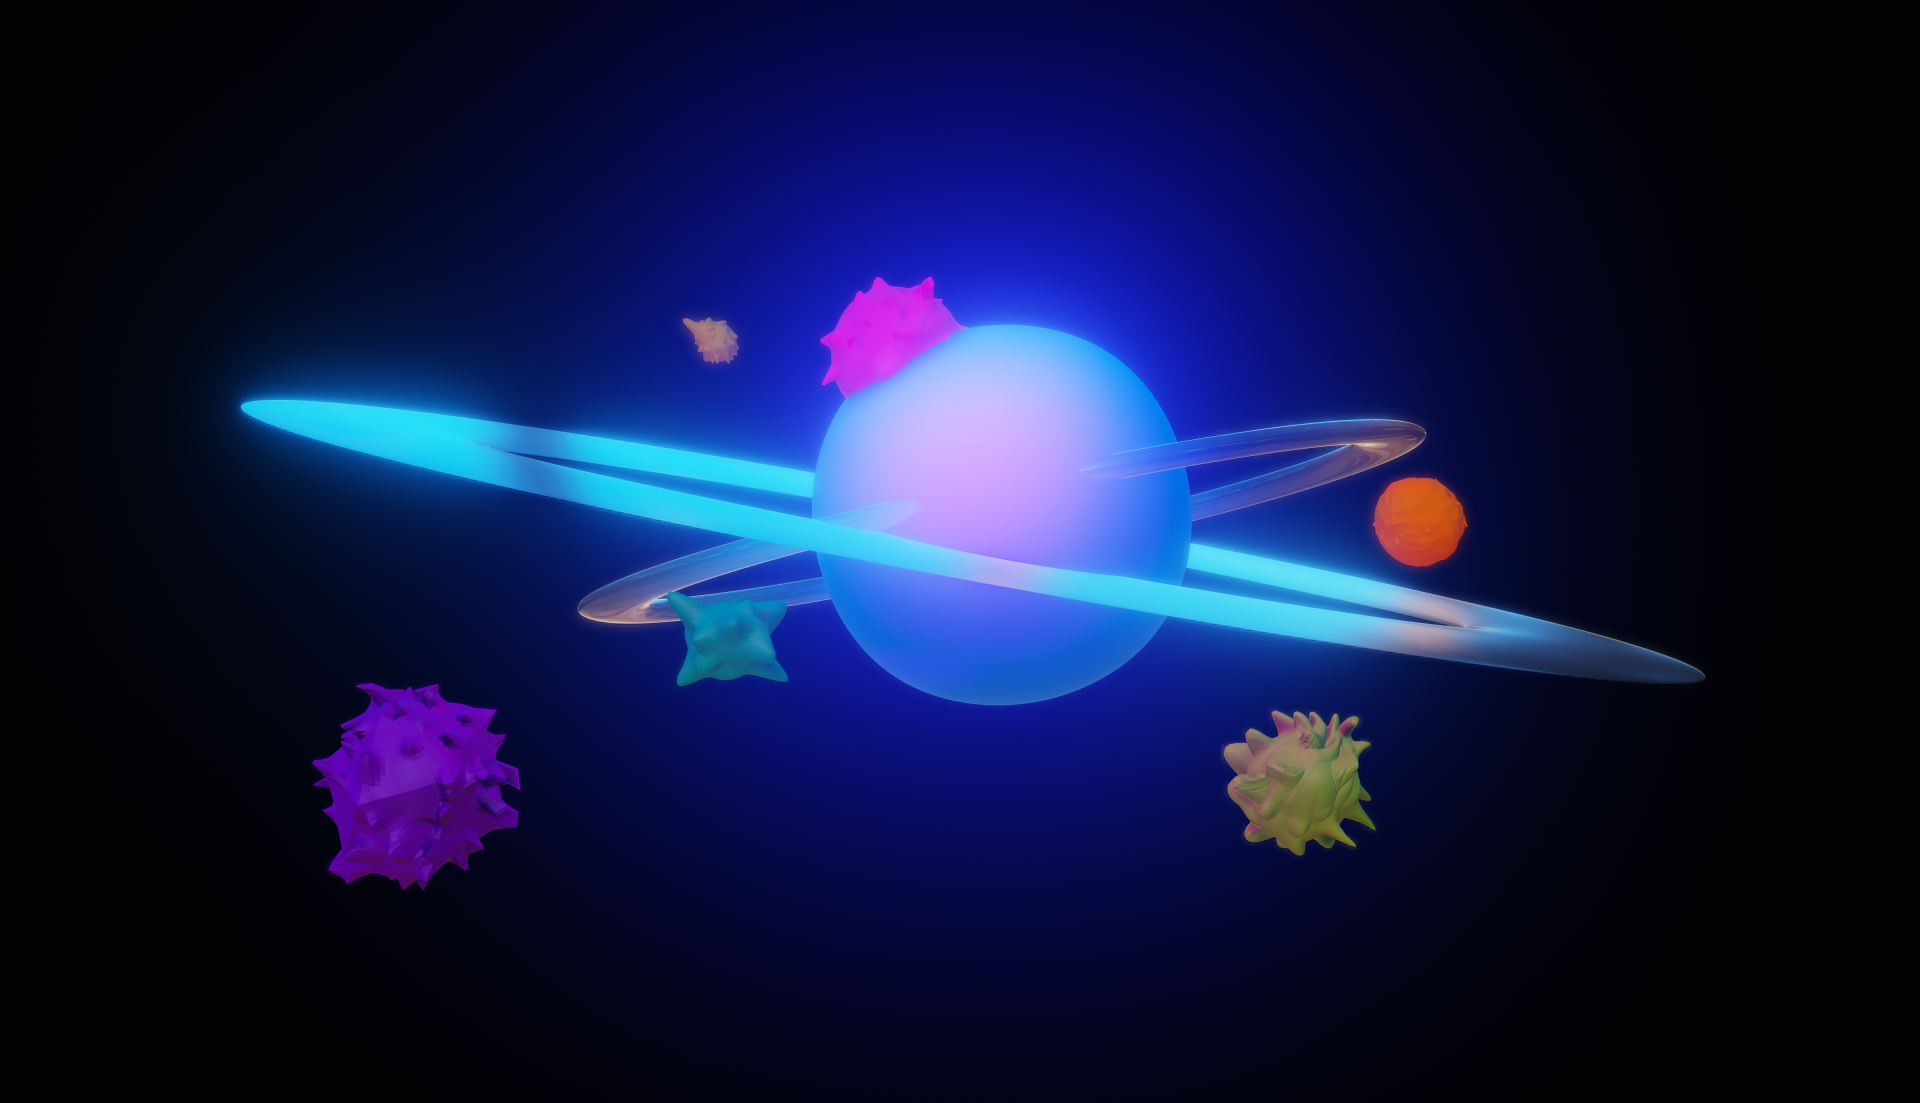
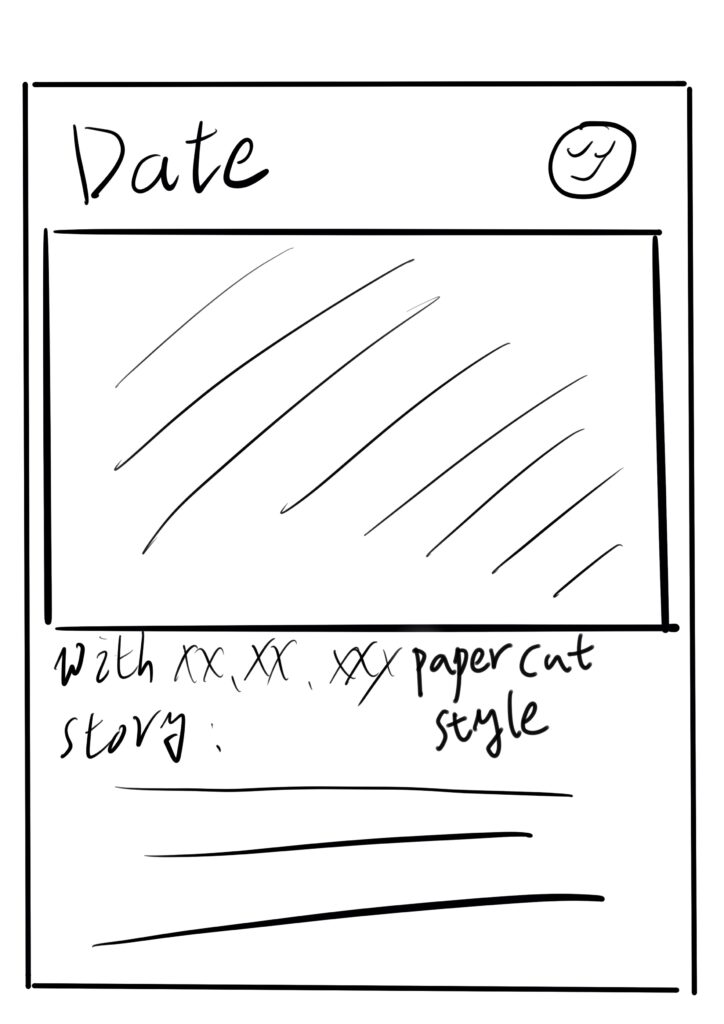
Here are some of my ideas for the final product.
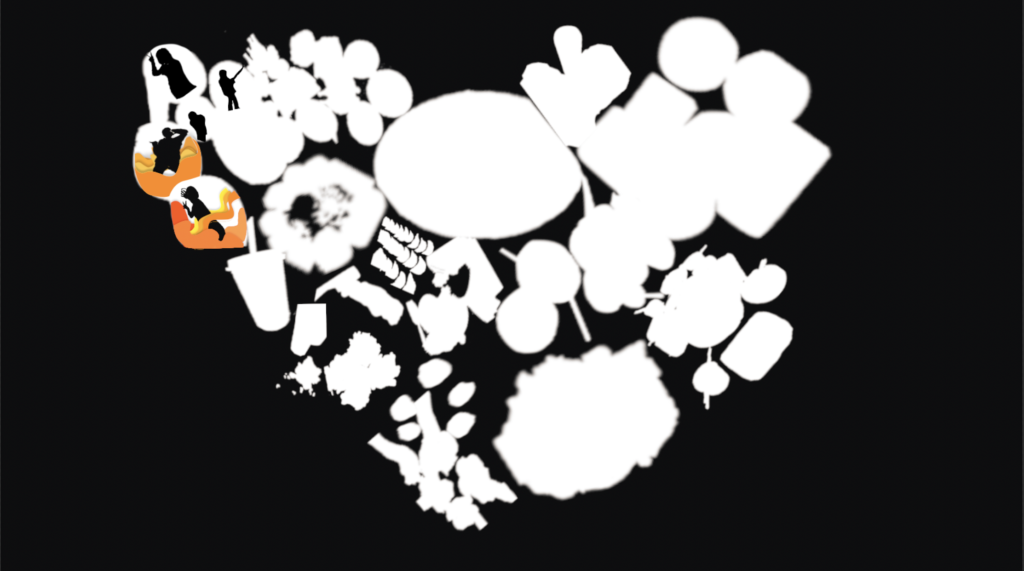
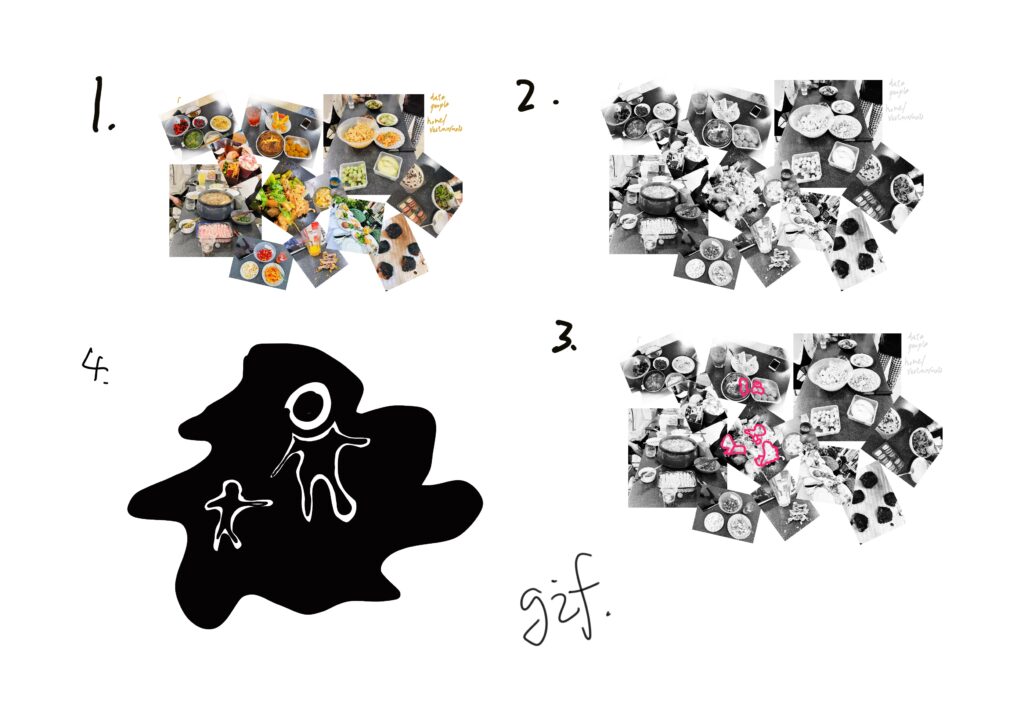
Then I started making it the way I wanted it to be, here are some pictures of my process.
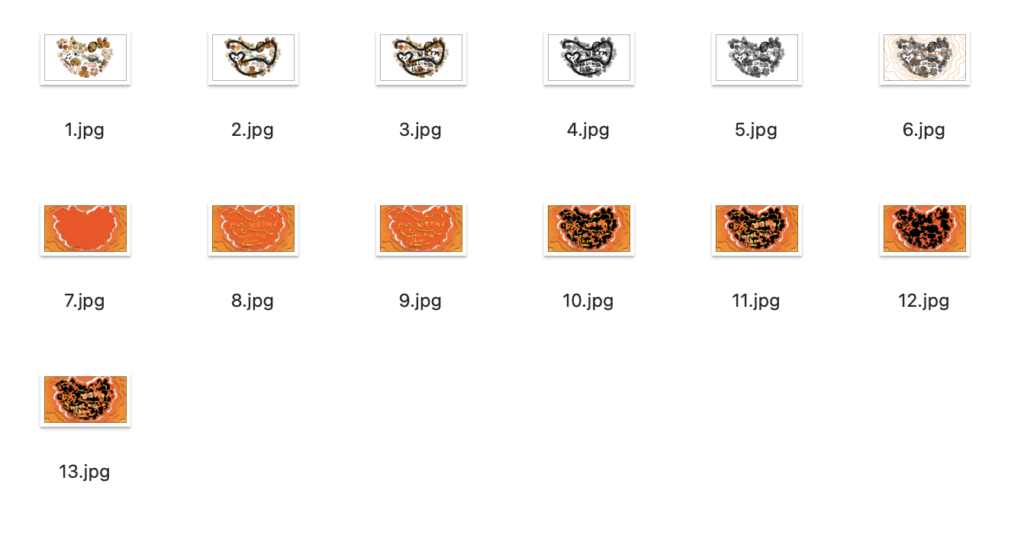
Here is a gif photo of process.

If the gif photo didn’t work, please download here
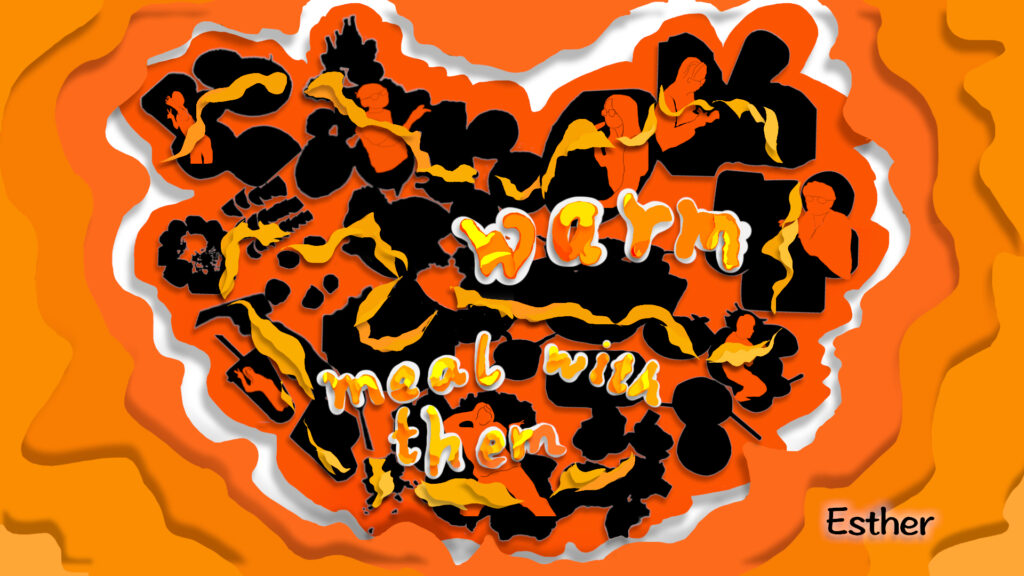
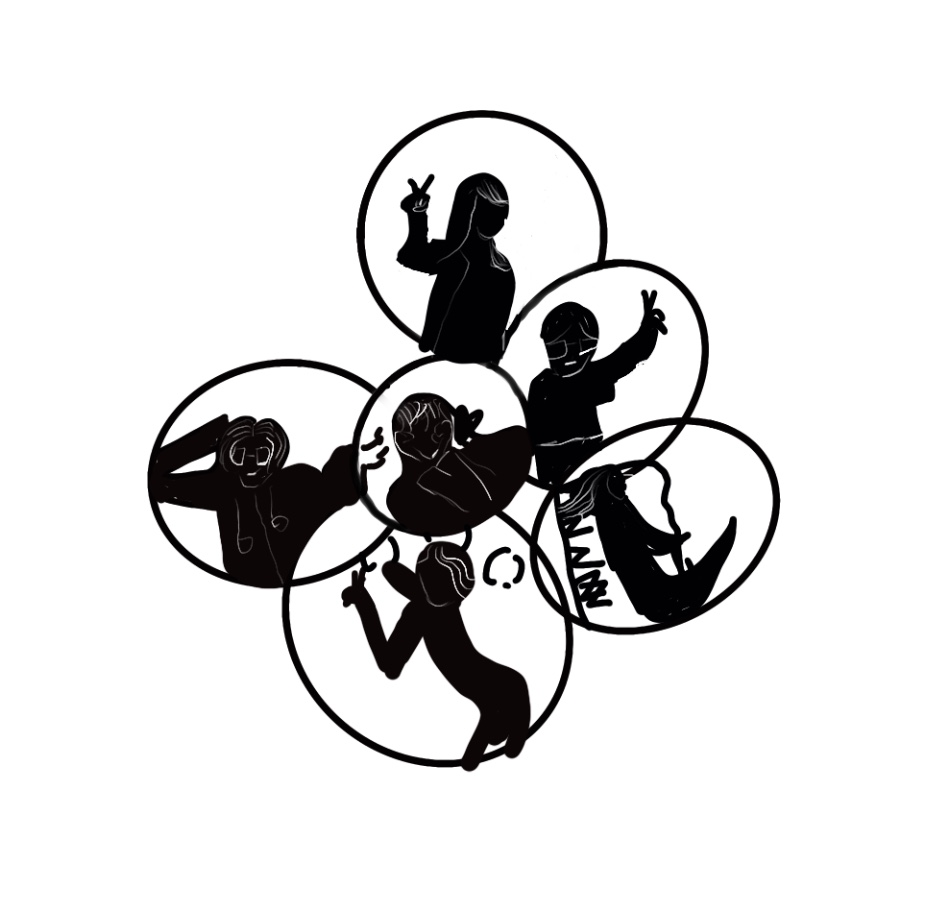
Final product.


If the gif photo didn’t work, please download here